

Metoro has made visibility into our Kubernetes environment effortless with on-demand event analysis and AI-driven root-cause investigations. Nothing is hidden anymore.
Uptime & Status Pages·Multi-region checks and status pagesUptime Monitoring
Uptime Monitoring
for Kubernetes
Run HTTP, TCP, UDP, DNS, and SSL checks from multiple regions. Route failures to your on-call tools and publish customer-facing status pages from the same checks.
status · public uptime page
Trusted by hundreds of the best at



Porter


Remy Security


Porter


Remy Security
DocioHealth

Porter
Capabilities
Check endpoints, publish status, and route incidents.
Schedule probes for public APIs, internal ports, DNS records, and certificates. Failed checks carry Kubernetes context so responders can jump to the service, pods, traces, logs, and events behind the alert.
Multi-protocol checks
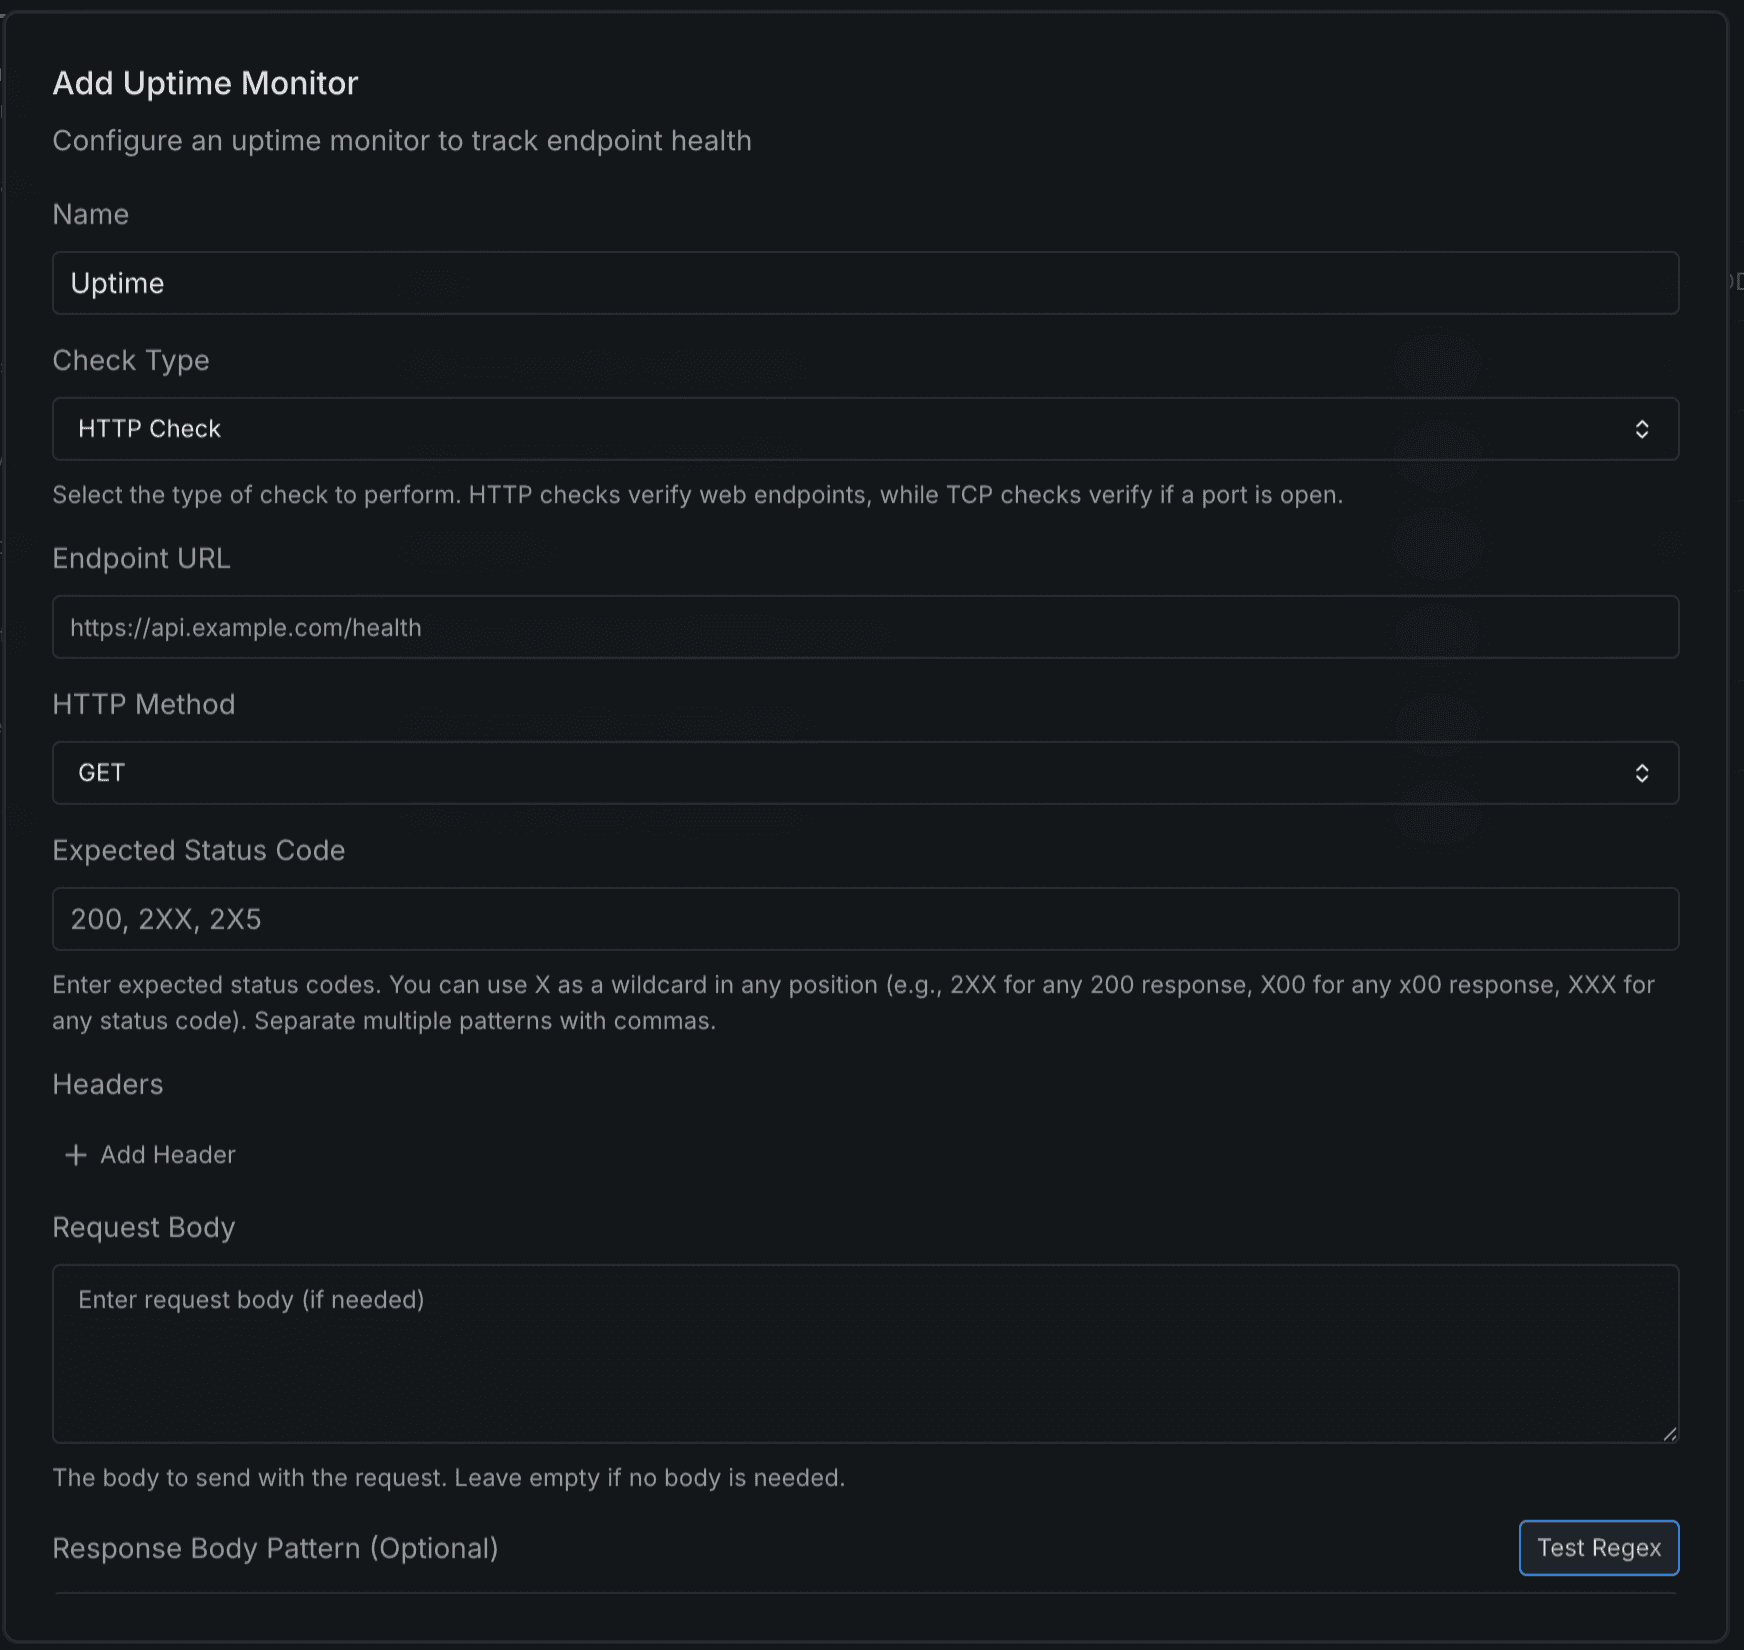
Monitor HTTP, TCP, UDP, DNS, and SSL.
Check public endpoints and private service ports from multiple regions . Metoro records availability and latency per probe, so regional failures are visible before they turn into guesswork.
- ✓HTTP / HTTPS with custom headers, auth and response validation
- ✓TCP and UDP port checks for databases and message queues
- ✓DNS resolution and SSL certificate expiry monitoring
uptime · check configuration
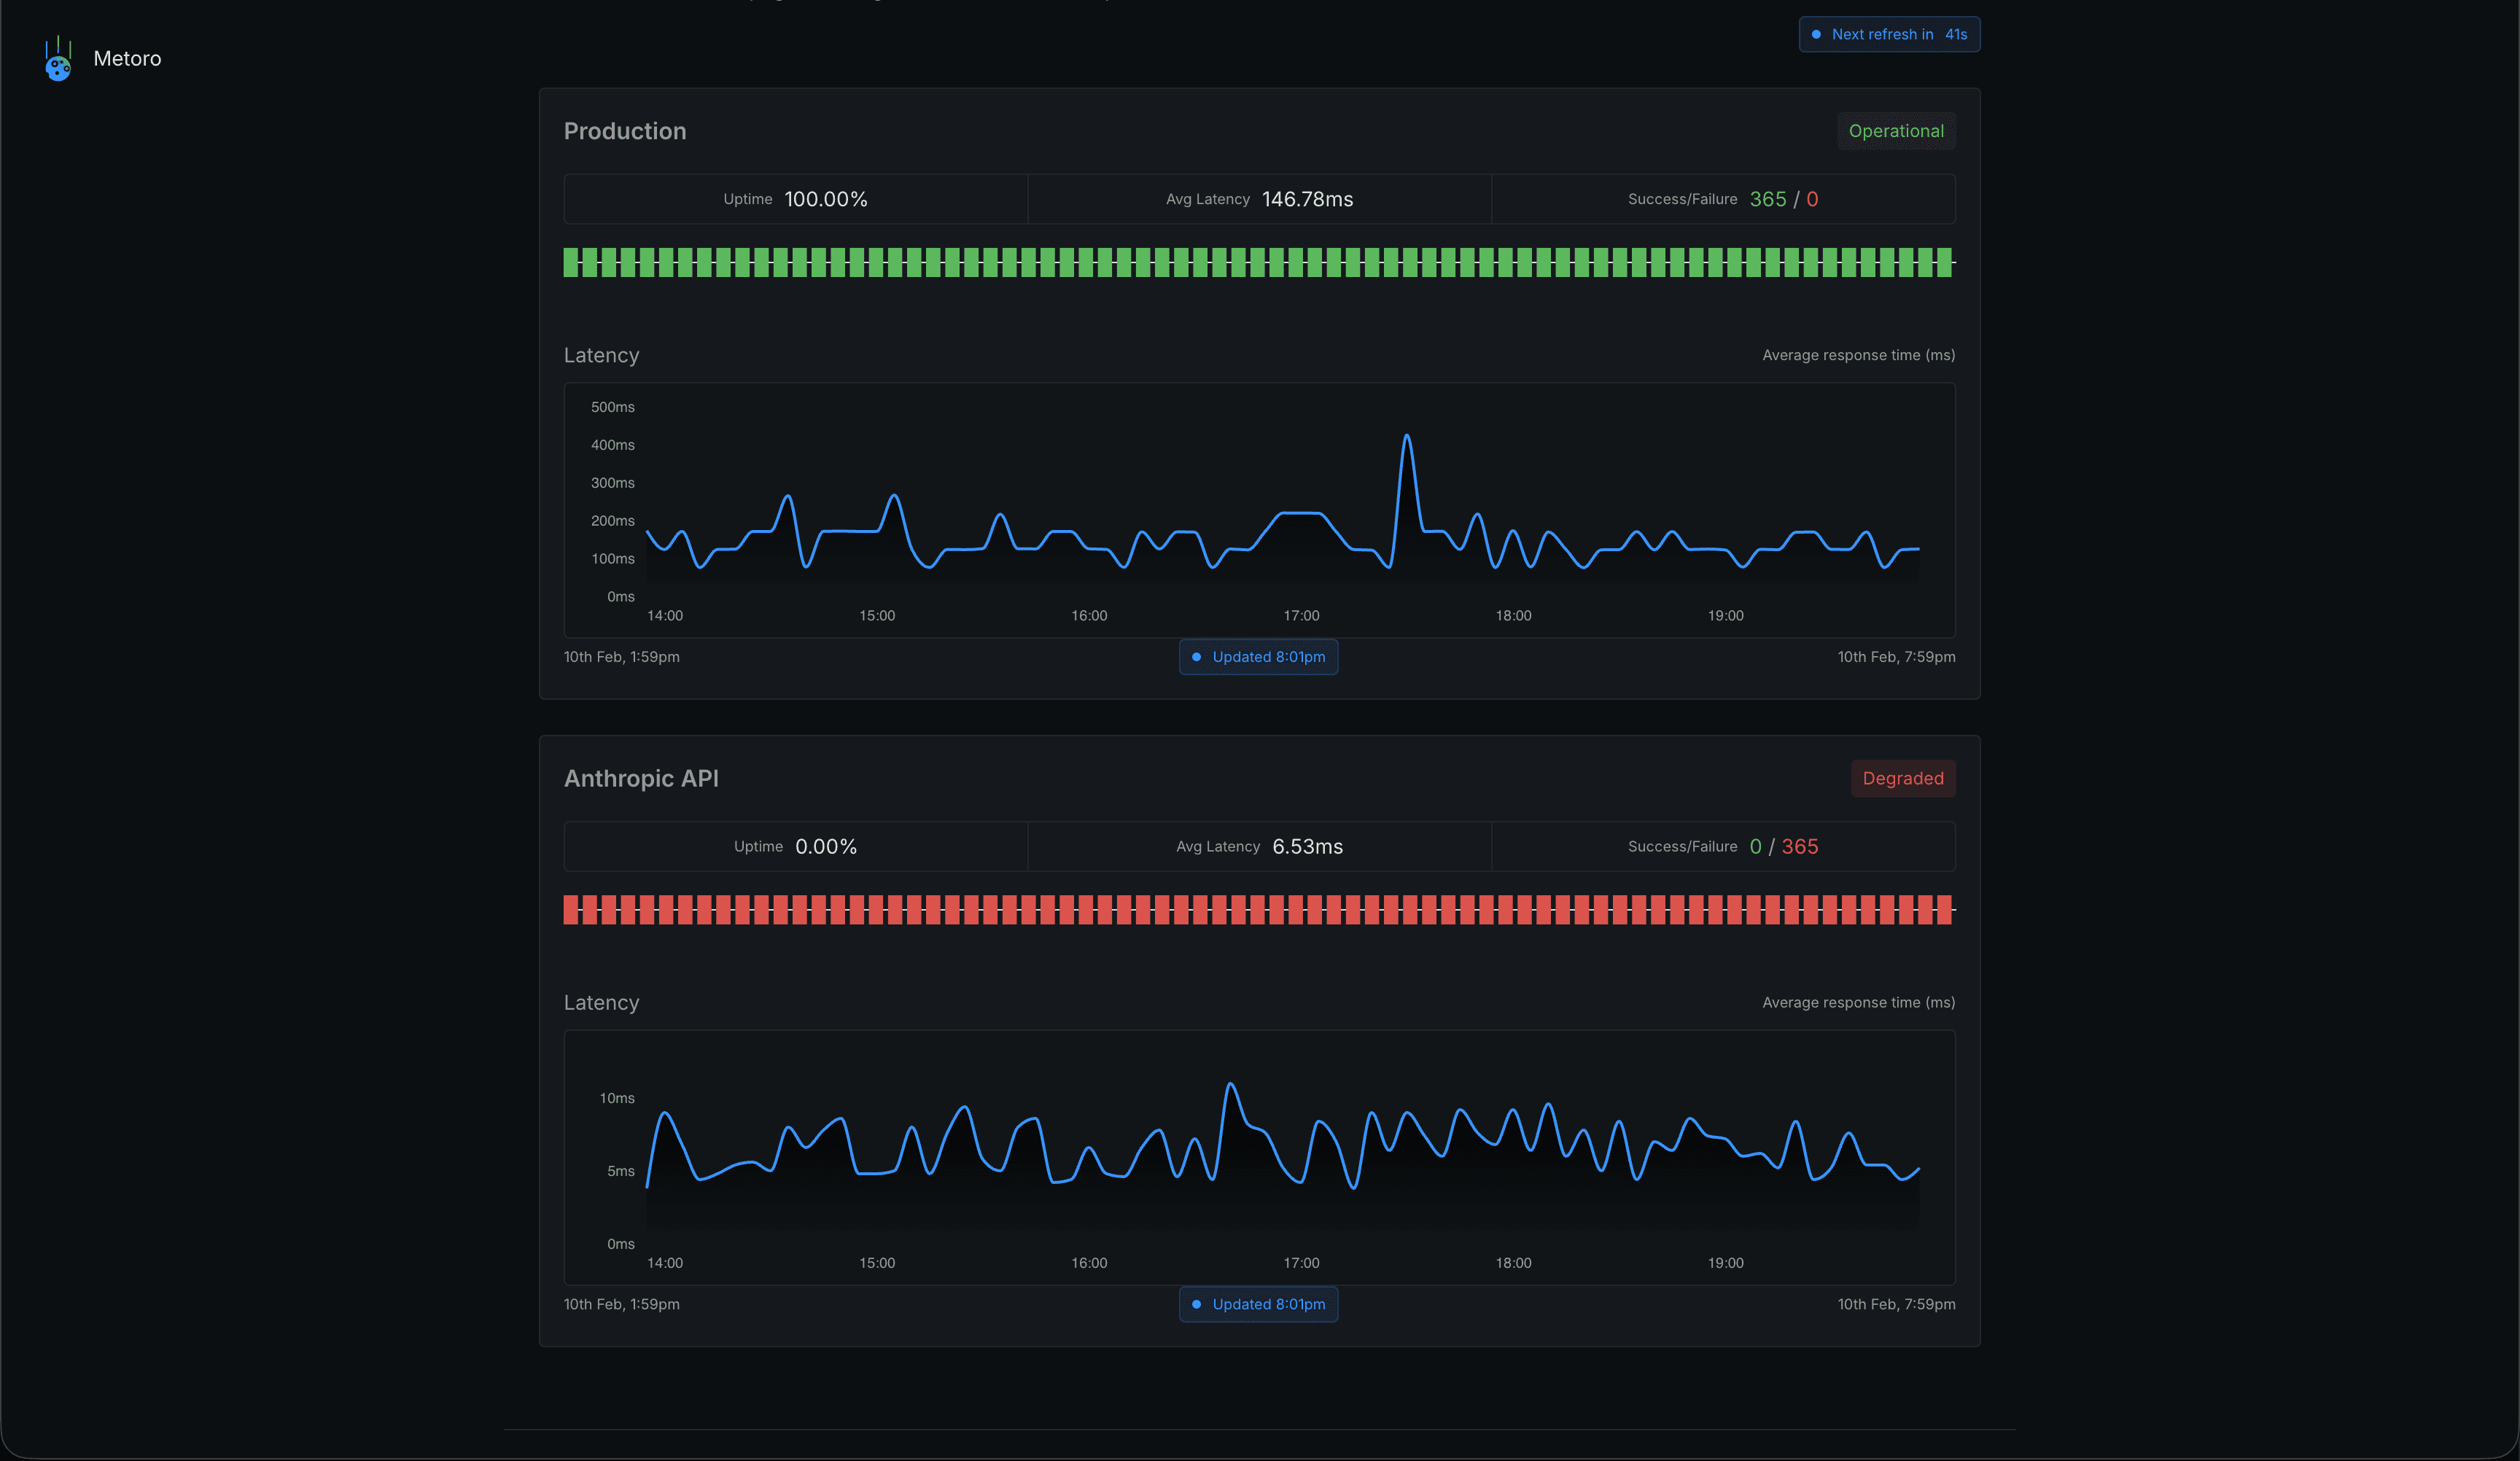
status.metoro.io · public page
Public status pages
Publish status pages from the same checks.
Expose selected checks on branded pages for customers and internal teams. The page uses the same availability results as your alerts, so incidents and maintenance windowsstay consistent.
- ✓Custom logo, colours and CNAME-mapped domain
- ✓Live status, incident timeline and scheduled maintenance
- ✓90-day uptime history and SLA badges out of the box
Customer feedback
What teams are saying.
Metoro absolutely slaps, so good ❤️
Detection, investigation, and the fix PR - all before I finished reading the page. It's the first AI SRE that's actually earned its name.
Metoro has been a huge boon to our observability ecosystem; saving us time and effort getting the information we care about most out of our clusters. The only thing cooler than the tool has been the people behind it.
It found exactly what I was looking for in the logs. Amazing.
We used to spend an hour digging through dashboards when something broke. Now Metoro figures it out in minutes - our on-call engineers love it.
AI root cause analysis is just amazing. Helps us save a ton of time.
We installed Metoro, and it just worked.
I'm literally able to look up at a Slack notification from Metoro whilst having noodles, tap the link, access the Metoro dashboard, see what customers on Porter Cloud are doing and take a call in real-time. For me, that's the best thing ever.
In the last week, we've detected and blocked 10 malicious agents running on our infrastructure. Without Metoro, they would still likely be running.
Metoro made it incredibly simple for us to not just observe and trace logs, but also to dive into AI-driven investigations effortlessly - turning complex Kubernetes monitoring into a smooth, intuitive experience.
Anyone running user agents on their infrastructure needs a solution like Metoro. It's just a case of when, not if a malicious agent will be running.
FAQ
Frequently Asked Questions
Everything about Metoro uptime monitoring and status pages.
How does Metoro's uptime monitoring work?
Metoro runs scheduled health checks against each endpoint you configure: HTTP/HTTPS, TCP/UDP, DNS and SSL. Checks run from multiple regions, and failed checks are correlated with the pod, deployment and node behind the endpoint.
Can I create public status pages for my services?
Yes. Any uptime check can be exposed on a branded public status page with a custom logo, colours and your own CNAME-mapped domain. Status pages use the same check results as internal monitoring and include incident timelines, scheduled maintenance and 90-day uptime history.
What protocols can I monitor?
HTTP/HTTPS with custom headers and response validation, TCP and UDP port checks, DNS resolution, and SSL certificate expiry. Anything reachable from a Metoro probe - public APIs, internal services on a VPN, databases, message queues - can be checked on a schedule.
How do alerts work?
Send incidents to Slack, PagerDuty, email, SMS or any webhook. Metoro deduplicates duplicate failures, supports on-call rotations and escalation policies, and respects maintenance windows so planned changes never page someone.
How often are checks executed?
Every plan supports 1-minute checks; the smallest interval is 30 seconds for critical services. Each region runs the check independently, so you also get geographic latency data alongside availability.
How does this fit with the rest of Metoro?
Uptime monitoring uses the same service and Kubernetes context as Metoro APM, logs, traces and infrastructure monitoring. When a check fails, the alert links back to the relevant service, traces, logs and pod events.